Monitoring Endpoints with Blackbox Exporter
Most of the monitoring in the homelab is internal. Prometheus scrapes metrics that applications expose. But that only tells you the application thinks it's healthy. It doesn't tell you if a user can actually reach it.
Blackbox Exporter flips the perspective. Instead of asking "are you healthy?", it asks "can I reach you from the outside?" It probes HTTP endpoints, checks TLS certificates, measures response time, and reports back to Prometheus.
What it probes
A single module does all the work: http_2xx, the chart default. It follows redirects and expects a 200-299 response. One caveat worth knowing: an endpoint behind auth that answers 3xx or 4xx reads as down, so anything like that needs a module override per target.
The targets are the five services exposed through the Istio Gateway:
prometheus-blackbox-exporter:
  serviceMonitor:
    targets:
    - name: argocd
      url: https://argo.prd.ruiz.sh
    - name: grafana
      url: https://grafana.prd.ruiz.sh
    - name: prometheus
      url: https://prometheus.prd.ruiz.sh
    - name: thanos
      url: https://thanos.prd.ruiz.sh
    - name: minio
      url: https://minio.prd.ruiz.sh
Every probe goes over HTTPS and validates the TLS certificate along the way. If cert-manager fails to renew the wildcard cert, this is where I'd see it first.
The target list lives in per-environment values files because the hostnames differ (*.dev.ruiz.sh vs *.prd.ruiz.sh). Everything else, module, interval, timeout, is shared. I used to also probe internal health endpoints directly, but dropped them: kube-prometheus-stack already scrapes those services from the inside, and the whole point of Blackbox Exporter is the outside view.
The chart's serviceMonitor.targets generates one ServiceMonitor per target. It's the chart's native equivalent of the Probe CRD, and it saves writing those resources by hand.
How it works with Prometheus
Blackbox Exporter doesn't scrape targets on its own. Prometheus drives the whole flow:
sequenceDiagram
    participant P as Prometheus
    participant B as Blackbox Exporter
    participant T as Target
    P->>B: scrape /probe?target=URL
    B->>T: HTTP probe
    T-->>B: response (200, 3ms)
    B-->>P: probe_success=1<br>probe_duration=0.003<br>probe_http_status_code=200
Every 60 seconds, Prometheus makes an HTTP GET to Blackbox Exporter passing the target URL as a parameter. Blackbox Exporter receives the request, tests the endpoint right then, and returns the result as metrics: success or failure, response time, HTTP status code, TLS certificate expiry. Blackbox Exporter doesn't store anything. It only runs the test when Prometheus asks and returns the result immediately.
Prometheus stores those metrics like any other time series, which means you can query them in Grafana, build dashboards, and create alerts.
Alerting on probes
A Grafana-managed rule (BlackboxProbeFailed) watches probe_success against Thanos: any probe failing for 5 minutes pages as critical, through the same Grafana alerting path as every other alert in the cluster.
For TLS expiry, the alert that pages watches cert-manager's own expiry metric (CertExpiringSoon, under 7 days). Blackbox's probe_ssl_earliest_cert_expiry is the independent second signal: two sources have to agree the certificate is fine, and the dashboard shows both. If they disagree, something is wrong.
The Grafana dashboard
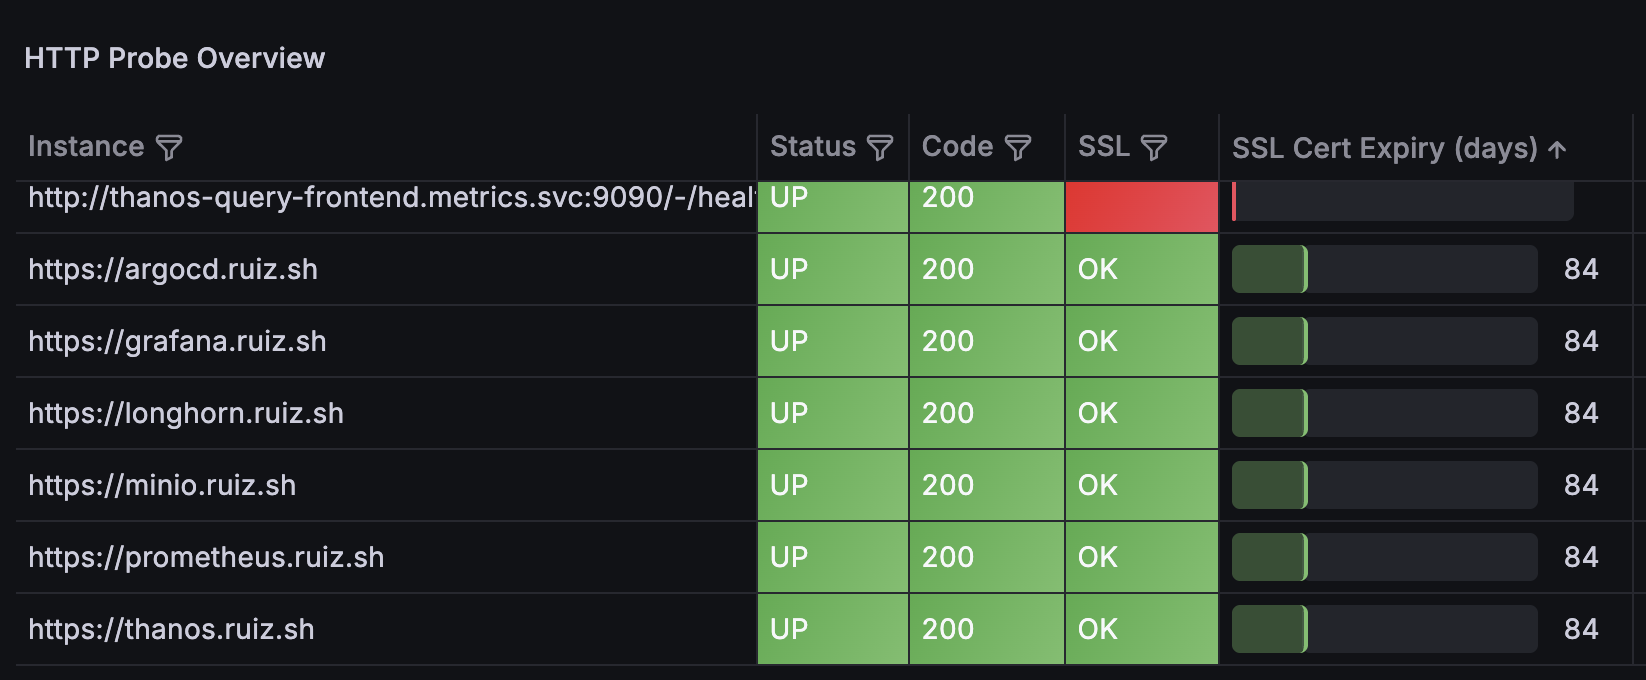
There's a ready-made Blackbox Exporter HTTP Prober dashboard on Grafana's dashboard marketplace that works out of the box. I provision it as a ConfigMap so the Grafana sidecar loads it automatically, with the datasource rewritten to Thanos. It shows all probed targets with their status, response time, and HTTP status codes.
Blackbox Exporter is lightweight (50m CPU, 100Mi memory requested in production) and runs on the small tier node. For what it does, it's one of the cheapest components in the stack.